

- Pyth Network has released its Publisher Metrics, a public dashboard of Pyth’s data providers’ performance metrics.
- Developers benefit from granular insight into Pyth’s data performance and its data providers' track records.
- Data providers benefit from new analytics and monitoring capabilities.
- This release is part of Pyth’s broader commitment towards transparency and verifiability — the fundamental values of DeFi.
Publisher Metrics is a new analytics feature on the Pyth Network website. The feature provides insights that will empower developers and data providers by providing the historical performance of the oracle network’s data sources. This powerful tool reflects our commitment to transparency and delivering timely, accurate, and valuable first-party data for everyone.
Pyth Network is unique in that all of its data is verifiable; any output can be traced back to its sources. Data providers in the network individually submit their prices and confidence intervals to the Pyth on-chain protocol, which then aggregates them. There are no off-chain components in the Pyth data distribution process, which guards against potential forms of manipulation found in off-chain designs. This level of transparency is one among many benefits of Pyth’s publisher network model.
Why Do We Need Publisher Metrics?
The Pyth Network has outlined a novel oracle network design to incentivize data provider (or "publishers") to provide their proprietary data on-chain for aggregation and dissemination cross-chain to decentralized applications.
Public dashboards showcasing the Pyth Network's data providers' historical performance will give the protocol's participants better insight into the network's performance and inform their ability to support the ecosystem.
Data Providers
Data providers are incentivized to provide timely, valuable data. These providers can use the new metrics feature to track their performance and benchmark themselves against one another. These performance metrics will become even more important when publishers are required to stake PYTH to publish and are able to participate in Pyth’s on-chain rewards program.
Data Users
The Publisher Metrics will allow end-users to evaluate the individual components (sources) of Pyth’s aggregate prices and participate in on-chain governance accordingly. Governance can affect many parameters of the network.
The Pyth Network is taking steps towards realizing the vision outlined in the whitepaper. Publisher Metrics are a critical first step toward providing the necessary information participants to make thoughtful, informed decisions within the network.
How to Use Publisher Metrics
Anyone can access the Publisher Metrics and monitor publishers’ performance on a per-product basis. Performance metrics include uptime, price-quality, and confidence interval accuracy. These metrics are in-line with the variables that will ultimately be used to determine publishers scoring and rewards, once the full system is deployed.
Accessing the Metrics
You can start at the Pyth Markets page, which will list every market symbol (“product”). Clicking on any product will bring you to the corresponding product page. We will use the SOL/USD product page as our example.
Each product page has a list of price components (representing each publisher by their publisher keys). Each component will link to the corresponding Publisher Metrics page.
Once you are on a product page, you can click on a publisher key (highlighted in yellow) under “Price Components” to access the Publishers Metrics page.

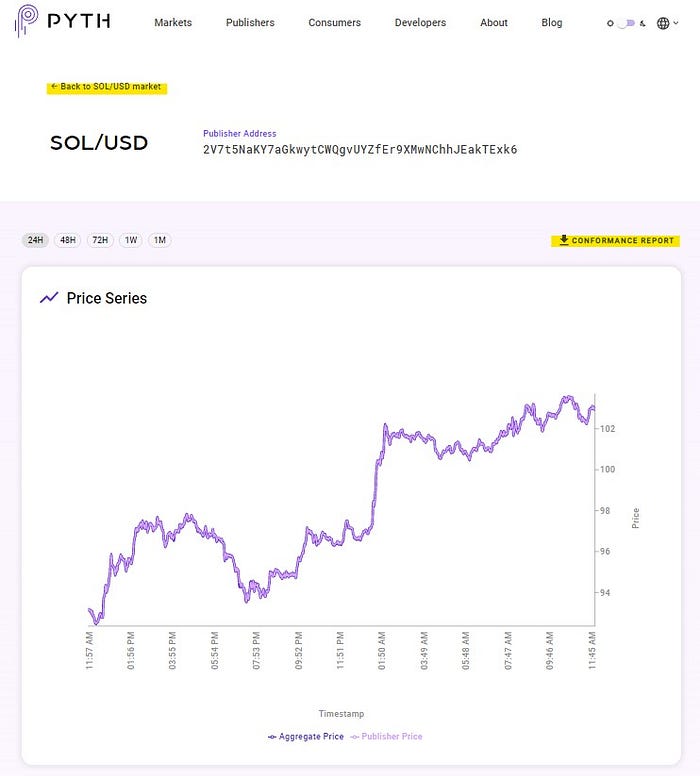
On the Metrics Page for a specific publisher, you will find the metrics graphs and the option to download a Conformance Report (TSV file).
To open the metrics for another publisher (of that same product), you can click on the “Back to the [SOL/USD] market”.
If you want to review the Publisher Metrics of another product (e.g. ETH/USD), you will need to access the relevant product page. As mentioned, the Pyth Markets page has the full list of products.
Interpreting the Metrics
The Metrics Page shows four graphs derived from the publisher’s prices over a chosen time interval (24H, 48H, 72H, 1W, and 1M) for a single product (price feed):
The price graph shows how a publisher’s price compares to the aggregate price, illustrating how closely the two prices track each other, and whether there were any periods where the publisher deviated significantly from the rest of the market.

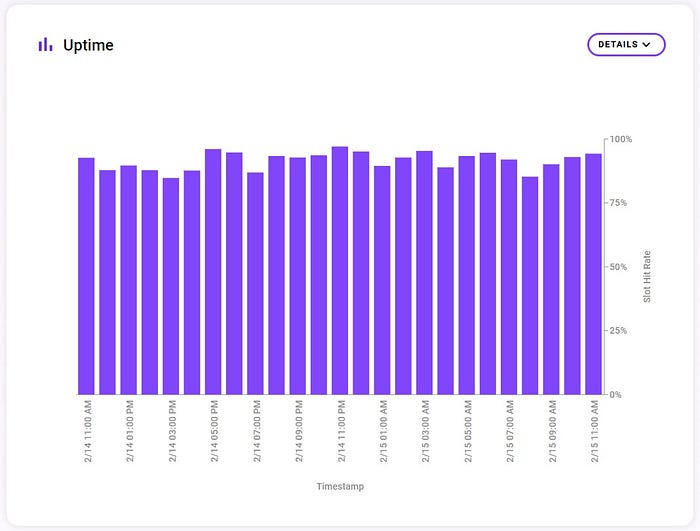
The uptime graph shows when the publisher was actively contributing prices. The x-axis subdivides the time interval into bins, and the y-axis is the % of slots in that bin where the publisher’s price was recent enough to be included in the aggregate. This graph lets you determine the regularity and reliability of a publisher.
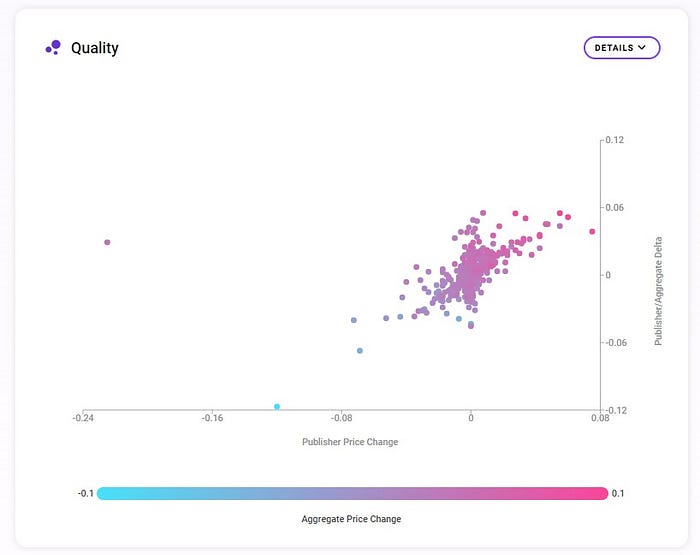
The quality graph shows the dataset used in the regression model for computing the quality score. The quality score measures how well a publisher’s price series predicts future changes in the aggregate price. A smooth color gradient (from blue on the bottom left to pink on the top right) indicates a high-quality score.
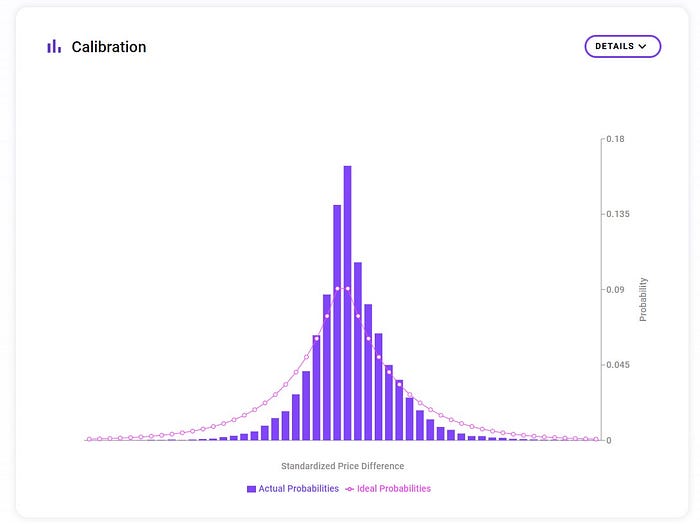
The calibration graph shows how closely the publisher’s prices and confidences match the expected Laplace distribution. The closer the fit between the two distributions, the higher the calibration score. In other words, a perfect publisher should produce a uniform histogram. As a reminder, the calibration score does not reward publishers for producing tighter confidence intervals; rather, the score captures whether the reported confidence interval corresponds to the publisher’s “true” confidence.
We can’t wait to hear what you think! You can join the Pyth Discord and Telegram and follow us on Twitter. You can also learn more about Pyth here.

Stay Updated with Pyth
Stay informed about Pyth network's development and upcoming events!


